import re
import time
import numpy as np
import pandas as pd
import jieba
import jieba.posseg as pseg
from PIL import Image
from wordcloud import WordCloud
import seaborn as sns
import matplotlib.ticker as mticker
import matplotlib.transforms as mtransforms
from matplotlib.colors import ListedColormap
from matplotlib import pyplot as plt
import matplotlib.pyplot as plt
from matplotlib import font_manager as fm
from tqdm import tqdm
from paddlenlp import Taskflow
%matplotlib inline
deftextFilter(text: str): text = text.lower() # try: # co = re.compile("[\U00010000-\U0010ffff]") # except re.error: # co = re.compile("[\uD800-\uDBFF][\uDC00-\uDFFF]") # text = co.sub(" ", text) co = re.compile("\[[\u4e00-\u9fa5]+\]") return co.sub(" ", text)
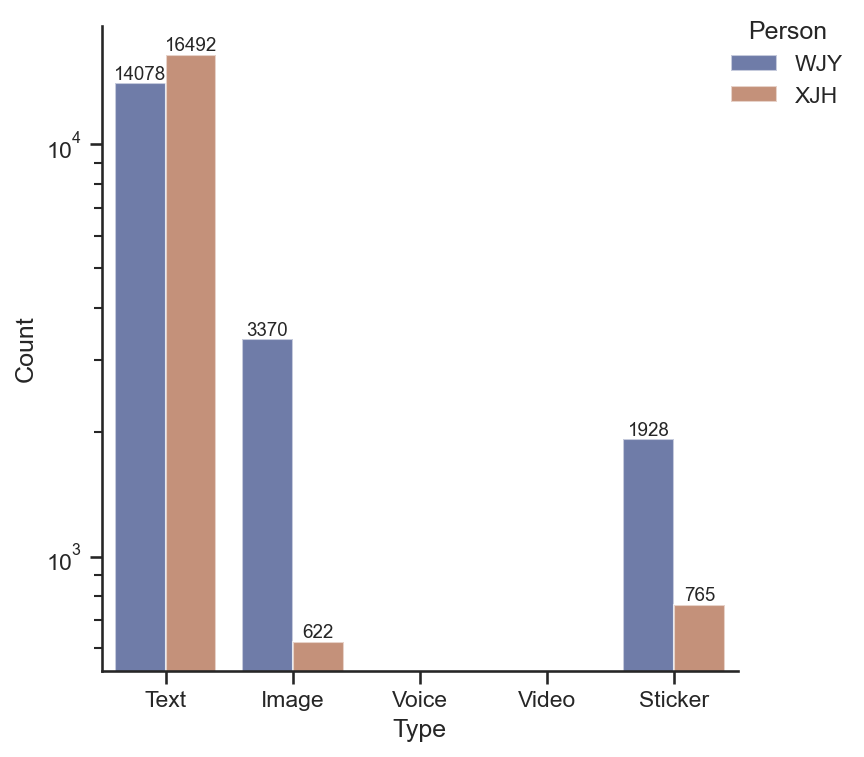
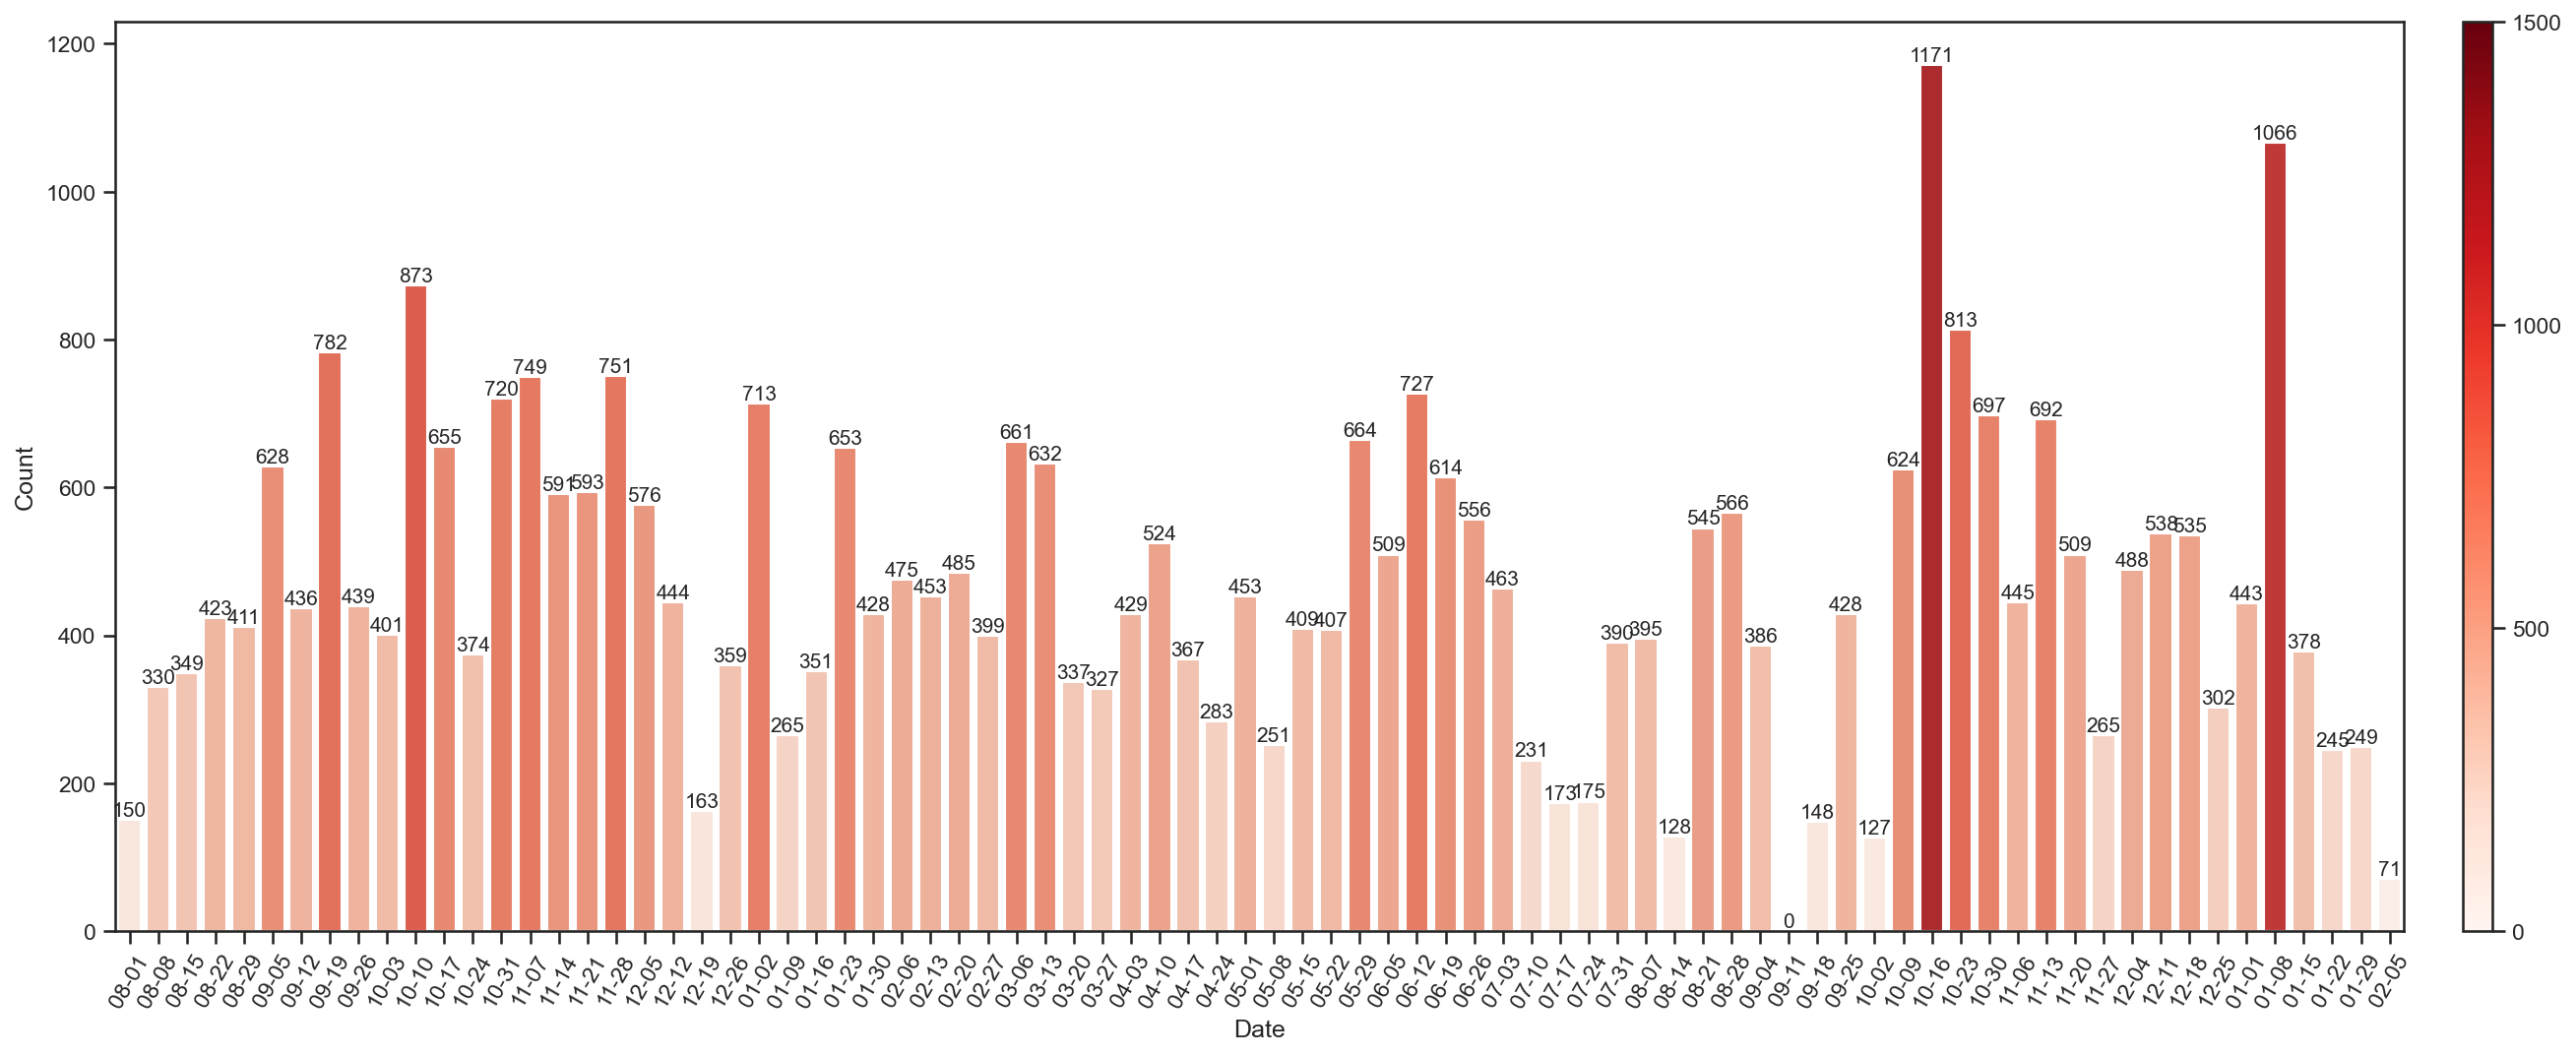
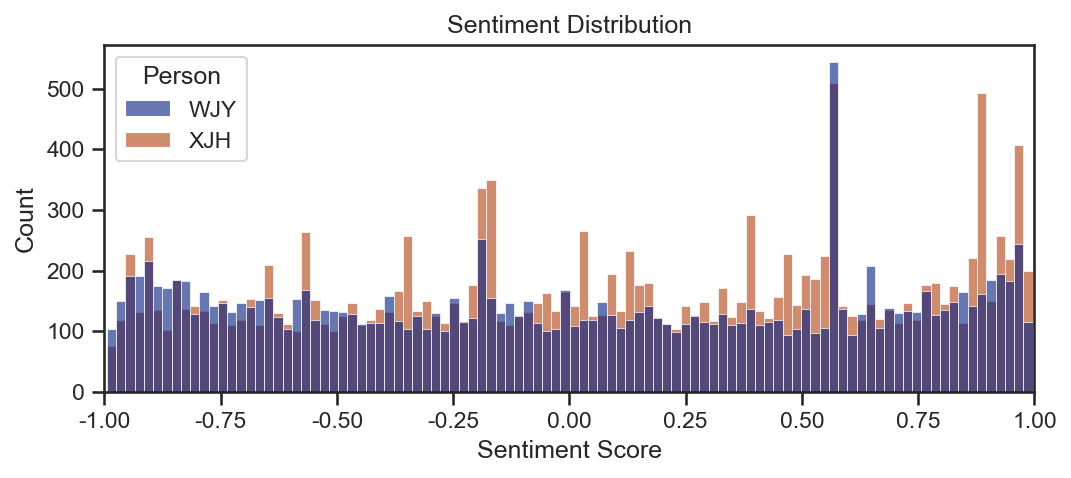
获取文本消息
1
2
3
4
texts = [
    [textFilter(i) for i in dfs[0].query("Type == 1")["StrContent"].to_list()],
    [textFilter(i) for i in dfs[1].query("Type == 1")["StrContent"].to_list()],
]
f:\ProgramData\miniconda3\envs\wechatmsg\lib\site-packages\pandas\core\groupby\grouper.py:381: FutureWarning: Dtype inference on a pandas object (Series, Index, ExtensionArray) is deprecated. The Index constructor will keep the original dtype in the future. Call `infer_objects` on the result to get the old behavior.
  ax = Index(obj[key], name=key)
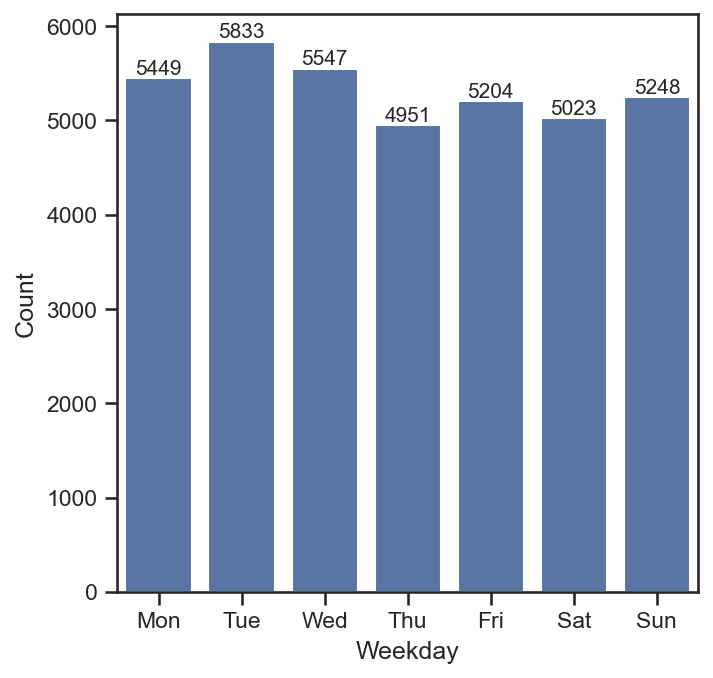
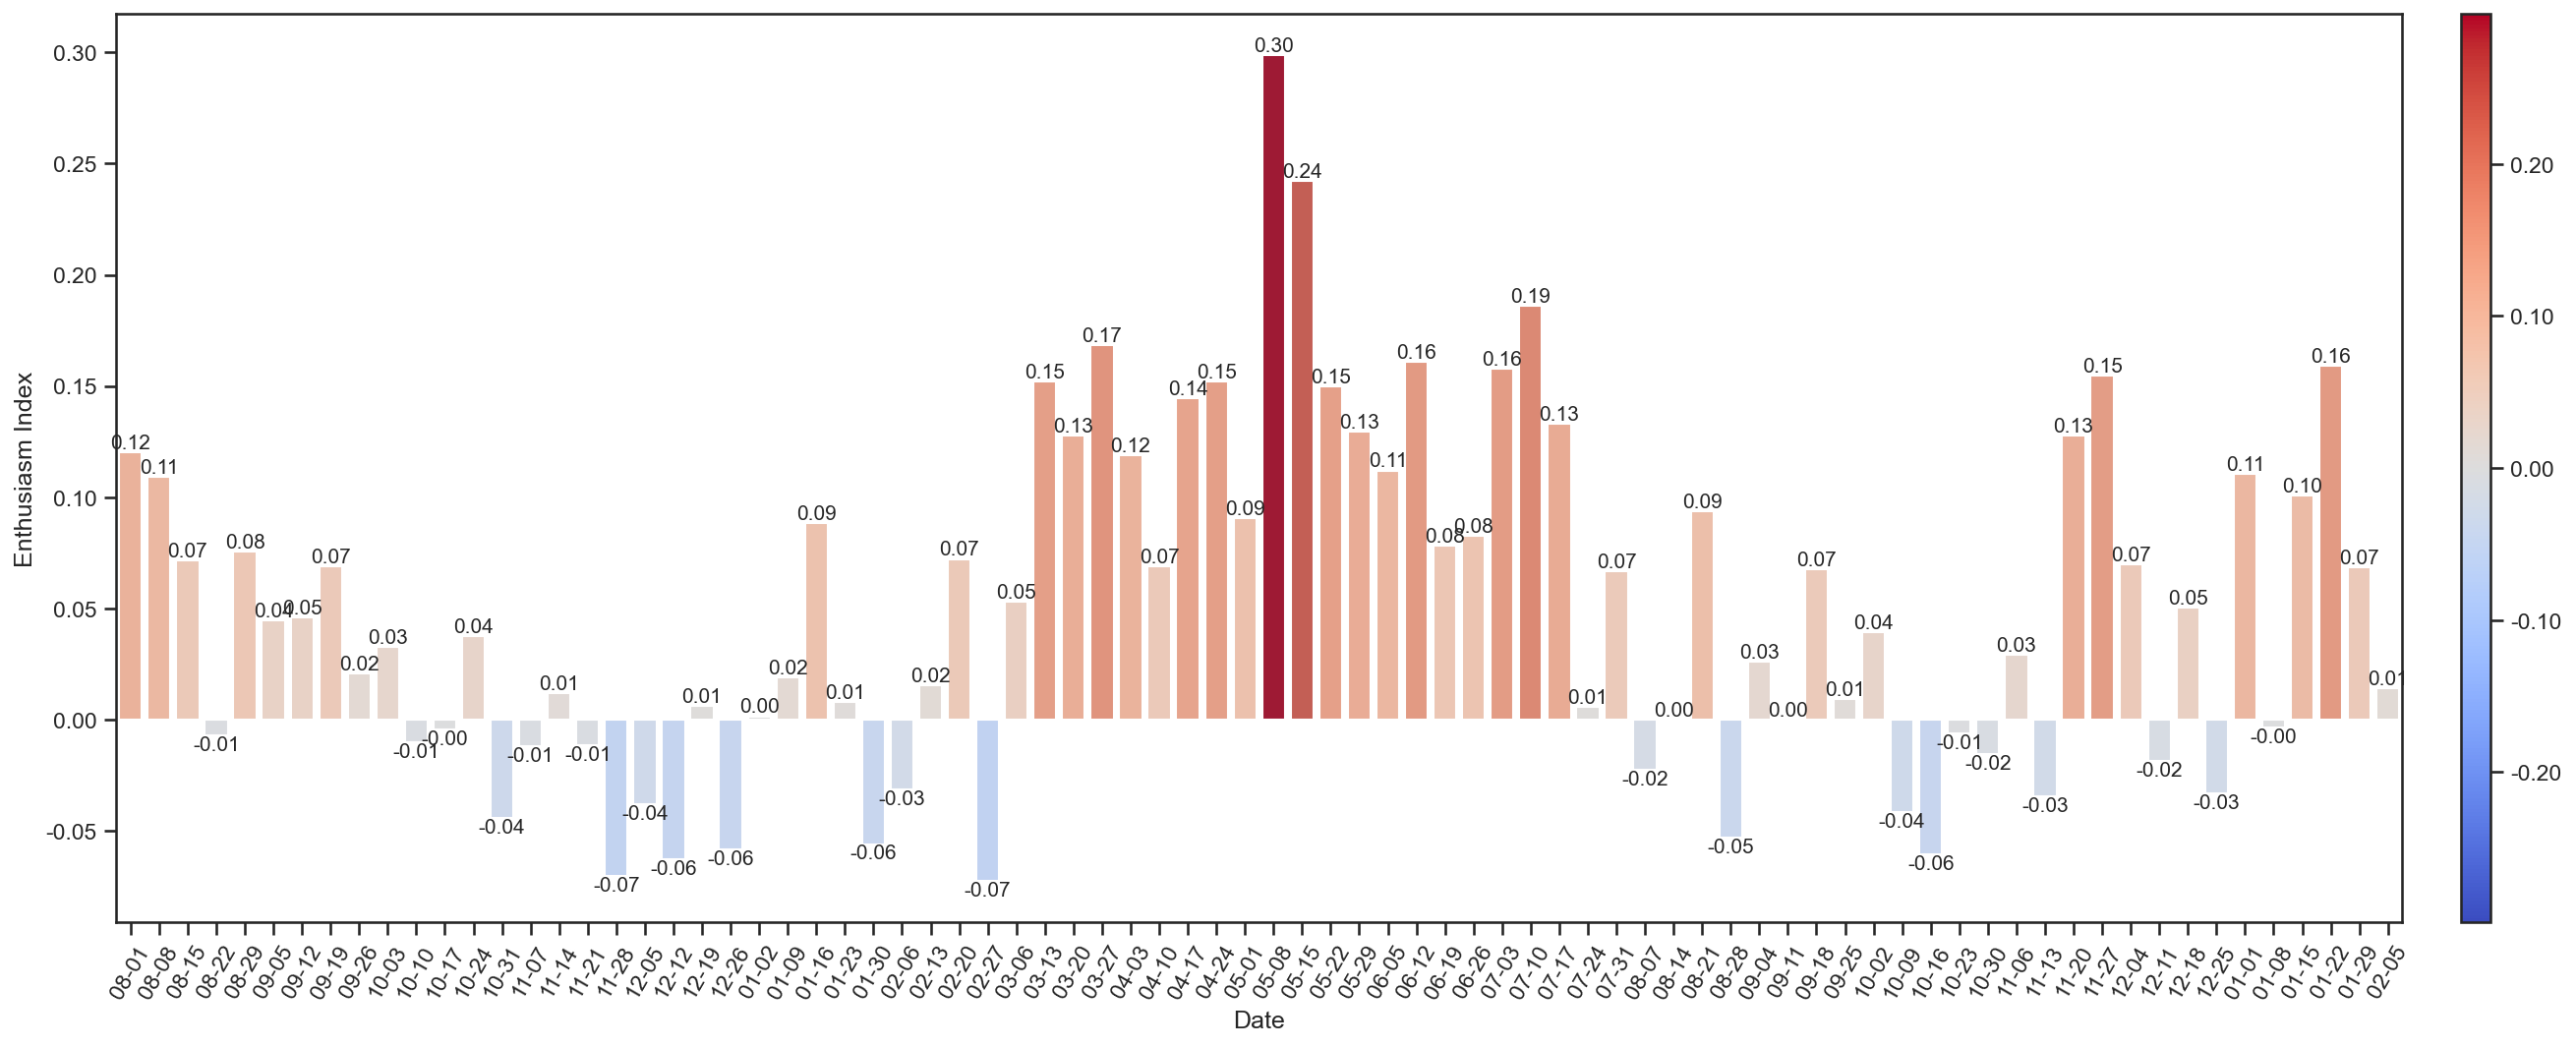
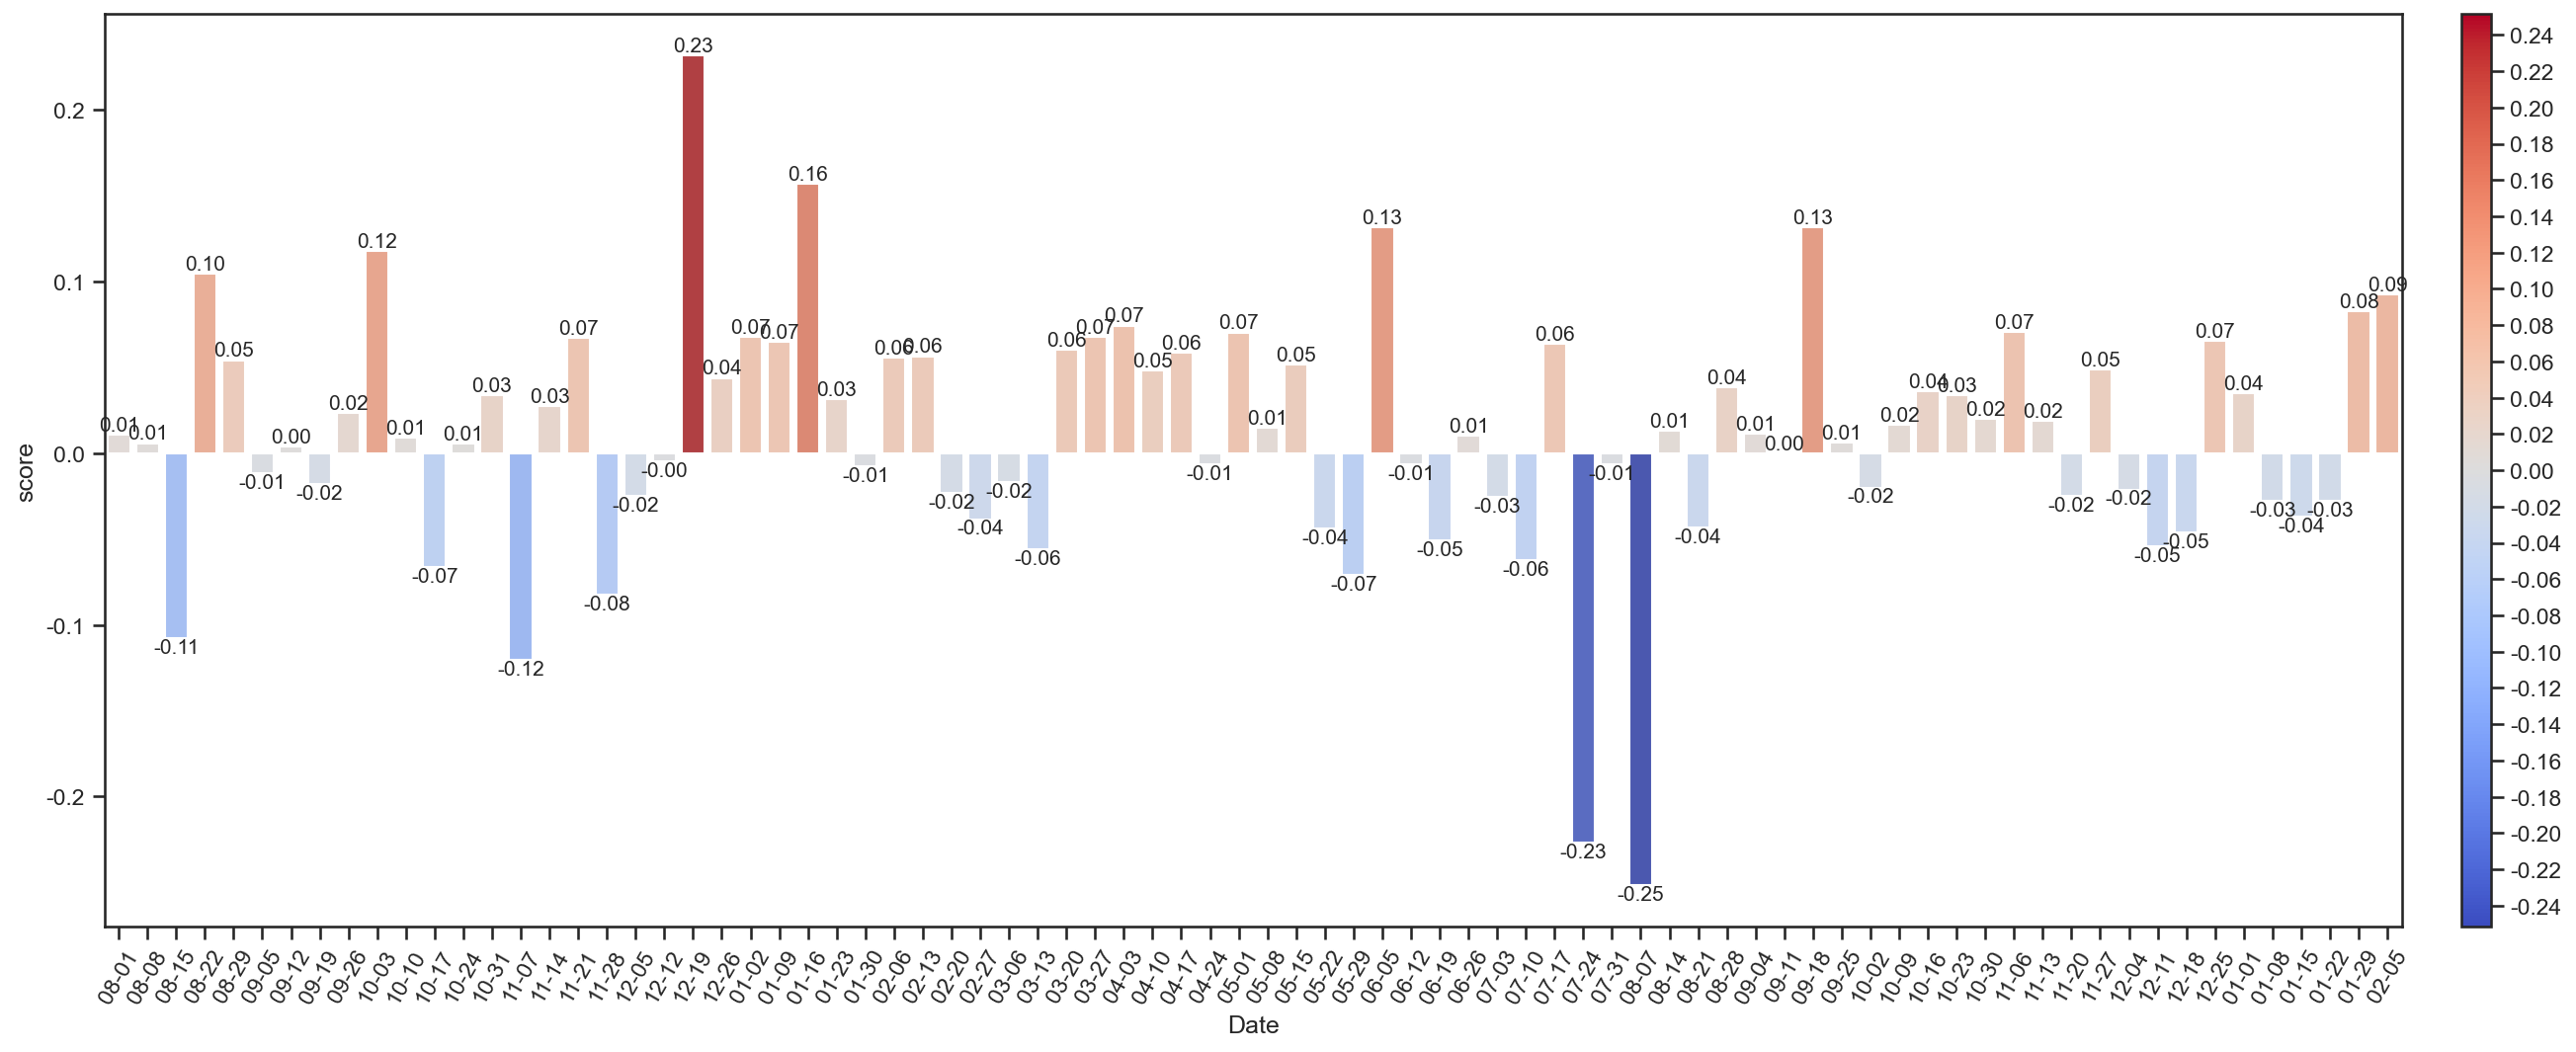
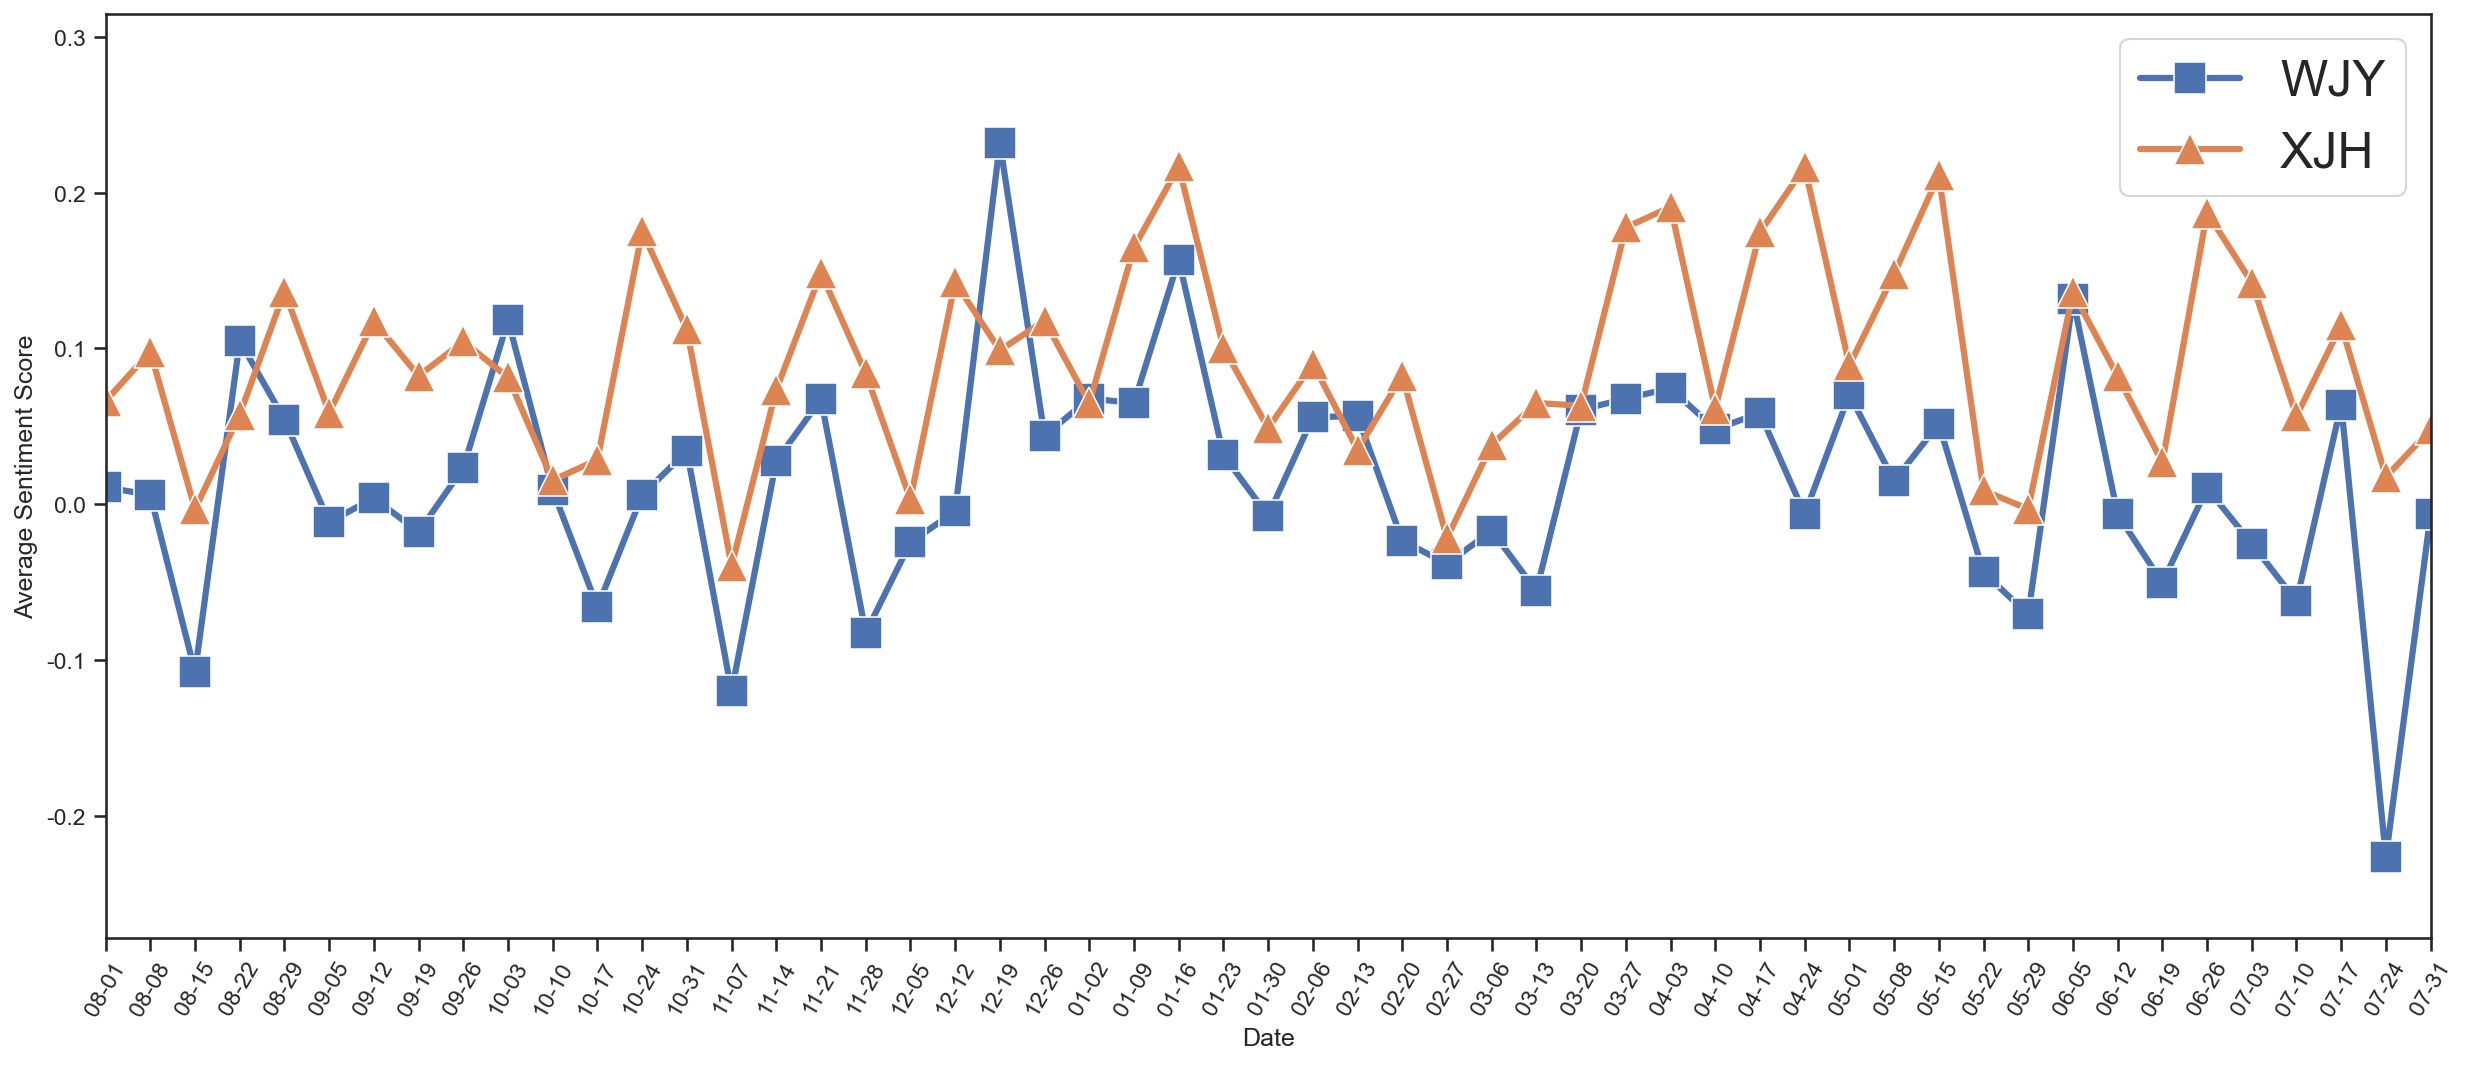
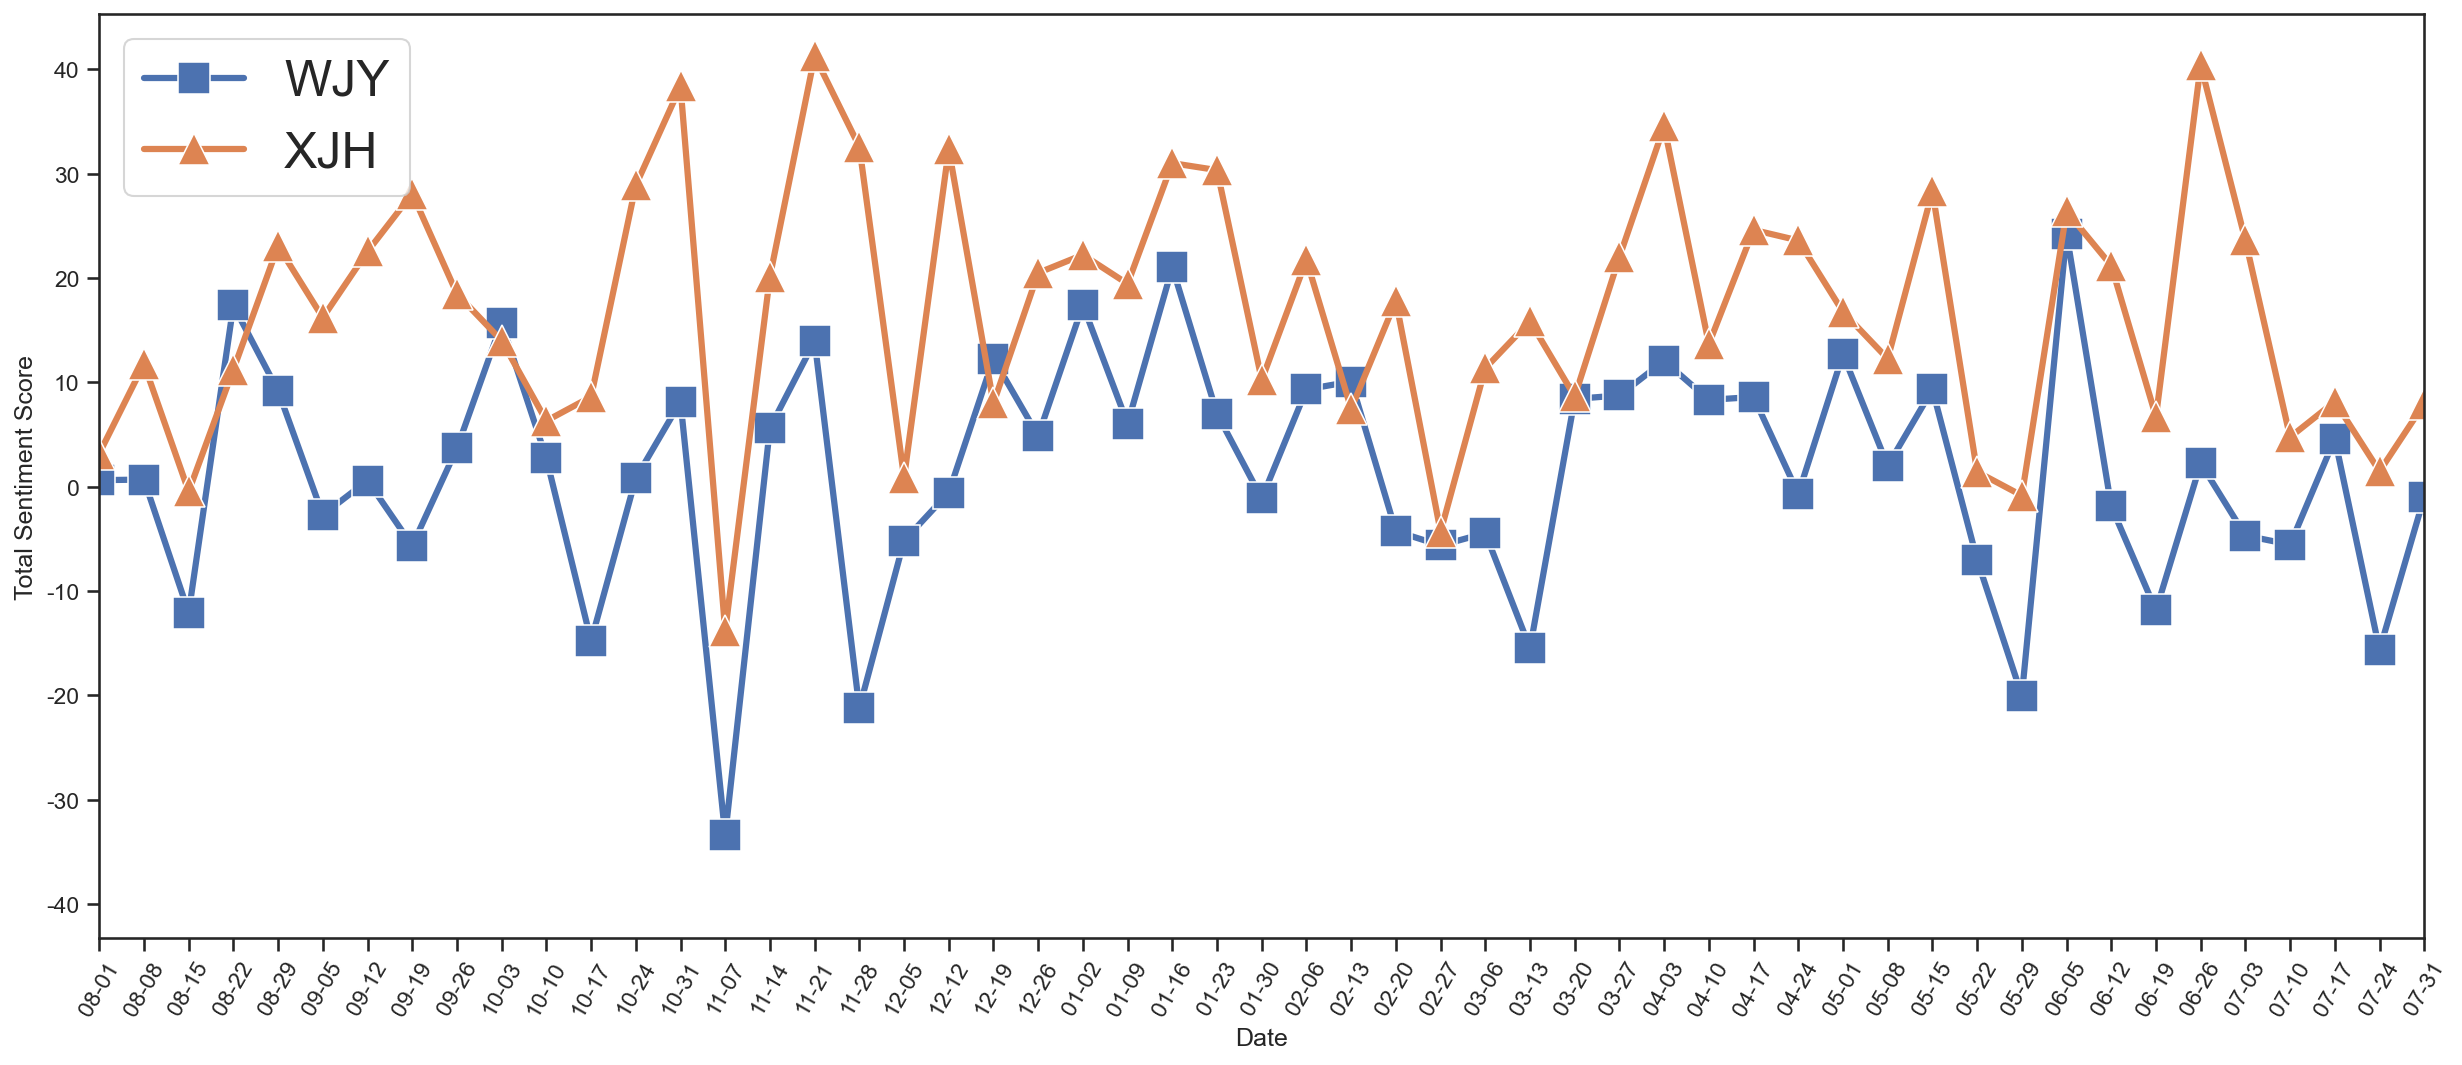
按周划分聊天热情分析
划分每7天内的聊天热情指数,聊天热情指数为发送的消息数减去收到的消息数与总消息数的比值: $$ E = \frac{Q_\mathrm{S} - Q_\mathrm{R}}{Q_\mathrm{S} + Q_\mathrm{R}} $$
f:\ProgramData\miniconda3\envs\wechatmsg\lib\site-packages\pandas\core\groupby\grouper.py:381: FutureWarning: Dtype inference on a pandas object (Series, Index, ExtensionArray) is deprecated. The Index constructor will keep the original dtype in the future. Call `infer_objects` on the result to get the old behavior.
  ax = Index(obj[key], name=key)
F:\user\Temp\ipykernel_9048\3741989350.py:18: FutureWarning: A value is trying to be set on a copy of a DataFrame or Series through chained assignment using an inplace method.
The behavior will change in pandas 3.0. This inplace method will never work because the intermediate object on which we are setting values always behaves as a copy.

For example, when doing 'df[col].method(value, inplace=True)', try using 'df.method({col: value}, inplace=True)' or df[col] = df[col].method(value) instead, to perform the operation inplace on the original object.
f:\ProgramData\miniconda3\envs\wechatmsg\lib\site-packages\pandas\core\groupby\grouper.py:381: FutureWarning: Dtype inference on a pandas object (Series, Index, ExtensionArray) is deprecated. The Index constructor will keep the original dtype in the future. Call `infer_objects` on the result to get the old behavior.
  ax = Index(obj[key], name=key)


     Count       date  week  day
0       46 2022-08-07     0    6
1      104 2022-08-08     0    0
2      100 2022-08-09     0    1
3       47 2022-08-10     0    2
4        3 2022-08-11     0    3
..     ...        ...   ...  ...
547     76 2024-02-05     6    0
548      0 2024-02-06     6    1
549      0 2024-02-07     6    2
550     47 2024-02-08     6    3
551     24 2024-02-09     6    4

[552 rows x 4 columns]
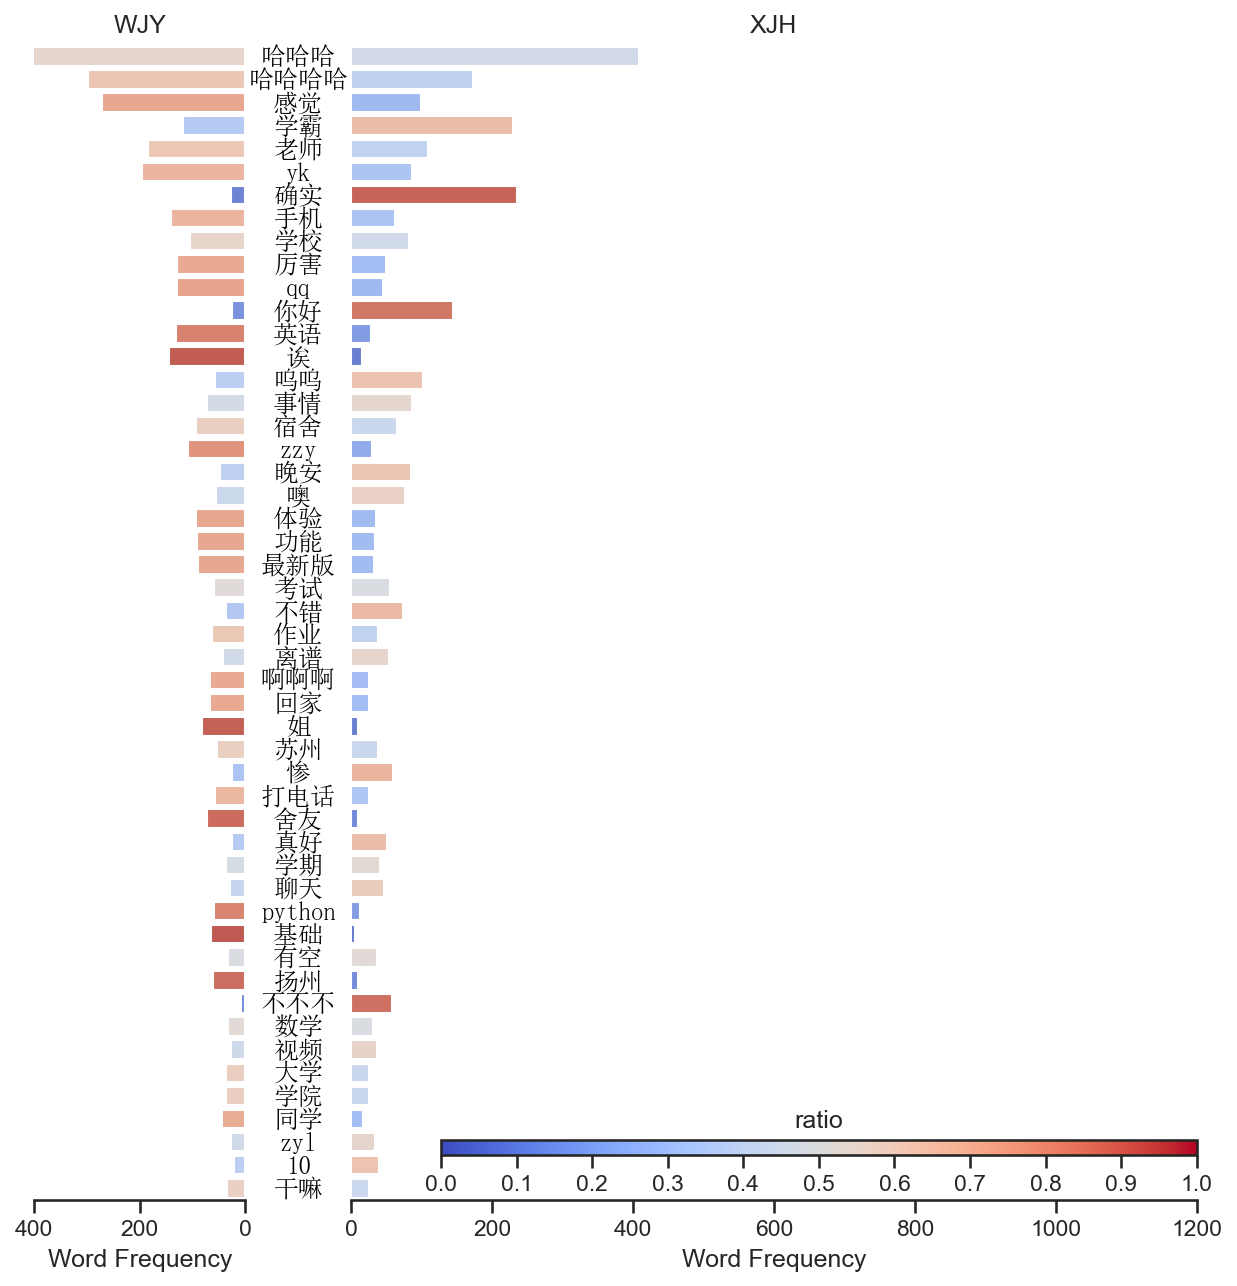
defwordSplit(texts, wordclass): words = [] pbar = tqdm(total=len(texts)) for i inrange(len(texts)): res = pseg.lcut(texts[i]) for pair in res: if pair.word in stopwords: continue if pair.flag in wordclass: continue words.append(pair.word) if i % 1000 == 0: pbar.update(1000) pbar.close() return words
1
words = [wordSplit(texts[i], wordclass) for i inrange(2)]
f:\ProgramData\miniconda3\envs\wechatmsg\lib\site-packages\pandas\core\groupby\grouper.py:381: FutureWarning: Dtype inference on a pandas object (Series, Index, ExtensionArray) is deprecated. The Index constructor will keep the original dtype in the future. Call `infer_objects` on the result to get the old behavior.
  ax = Index(obj[key], name=key)
F:\user\Temp\ipykernel_9048\3472776600.py:13: FutureWarning: A value is trying to be set on a copy of a DataFrame or Series through chained assignment using an inplace method.
The behavior will change in pandas 3.0. This inplace method will never work because the intermediate object on which we are setting values always behaves as a copy.

For example, when doing 'df[col].method(value, inplace=True)', try using 'df.method({col: value}, inplace=True)' or df[col] = df[col].method(value) instead, to perform the operation inplace on the original object.
data[“score”].fillna(0, inplace=True)
1
avgSenScore1 = weekAvgSenScore(dfEs[1])
f:\ProgramData\miniconda3\envs\wechatmsg\lib\site-packages\pandas\core\groupby\grouper.py:381: FutureWarning: Dtype inference on a pandas object (Series, Index, ExtensionArray) is deprecated. The Index constructor will keep the original dtype in the future. Call `infer_objects` on the result to get the old behavior.
  ax = Index(obj[key], name=key)
F:\user\Temp\ipykernel_9048\3472776600.py:13: FutureWarning: A value is trying to be set on a copy of a DataFrame or Series through chained assignment using an inplace method.
The behavior will change in pandas 3.0. This inplace method will never work because the intermediate object on which we are setting values always behaves as a copy.

For example, when doing 'df[col].method(value, inplace=True)', try using 'df.method({col: value}, inplace=True)' or df[col] = df[col].method(value) instead, to perform the operation inplace on the original object.
data[“score”].fillna(0, inplace=True)
1
_ = weekAvgSenScore(dfE)
f:\ProgramData\miniconda3\envs\wechatmsg\lib\site-packages\pandas\core\groupby\grouper.py:381: FutureWarning: Dtype inference on a pandas object (Series, Index, ExtensionArray) is deprecated. The Index constructor will keep the original dtype in the future. Call `infer_objects` on the result to get the old behavior.
  ax = Index(obj[key], name=key)
F:\user\Temp\ipykernel_9048\3472776600.py:13: FutureWarning: A value is trying to be set on a copy of a DataFrame or Series through chained assignment using an inplace method.
The behavior will change in pandas 3.0. This inplace method will never work because the intermediate object on which we are setting values always behaves as a copy.

For example, when doing 'df[col].method(value, inplace=True)', try using 'df.method({col: value}, inplace=True)' or df[col] = df[col].method(value) instead, to perform the operation inplace on the original object.
f:\ProgramData\miniconda3\envs\wechatmsg\lib\site-packages\pandas\core\groupby\grouper.py:381: FutureWarning: Dtype inference on a pandas object (Series, Index, ExtensionArray) is deprecated. The Index constructor will keep the original dtype in the future. Call `infer_objects` on the result to get the old behavior.
  ax = Index(obj[key], name=key)
1
totSenScore1 = weekTotSenScore(dfEs[1])
f:\ProgramData\miniconda3\envs\wechatmsg\lib\site-packages\pandas\core\groupby\grouper.py:381: FutureWarning: Dtype inference on a pandas object (Series, Index, ExtensionArray) is deprecated. The Index constructor will keep the original dtype in the future. Call `infer_objects` on the result to get the old behavior.
  ax = Index(obj[key], name=key)
1
_ = weekTotSenScore(dfE)
f:\ProgramData\miniconda3\envs\wechatmsg\lib\site-packages\pandas\core\groupby\grouper.py:381: FutureWarning: Dtype inference on a pandas object (Series, Index, ExtensionArray) is deprecated. The Index constructor will keep the original dtype in the future. Call `infer_objects` on the result to get the old behavior.
  ax = Index(obj[key], name=key)
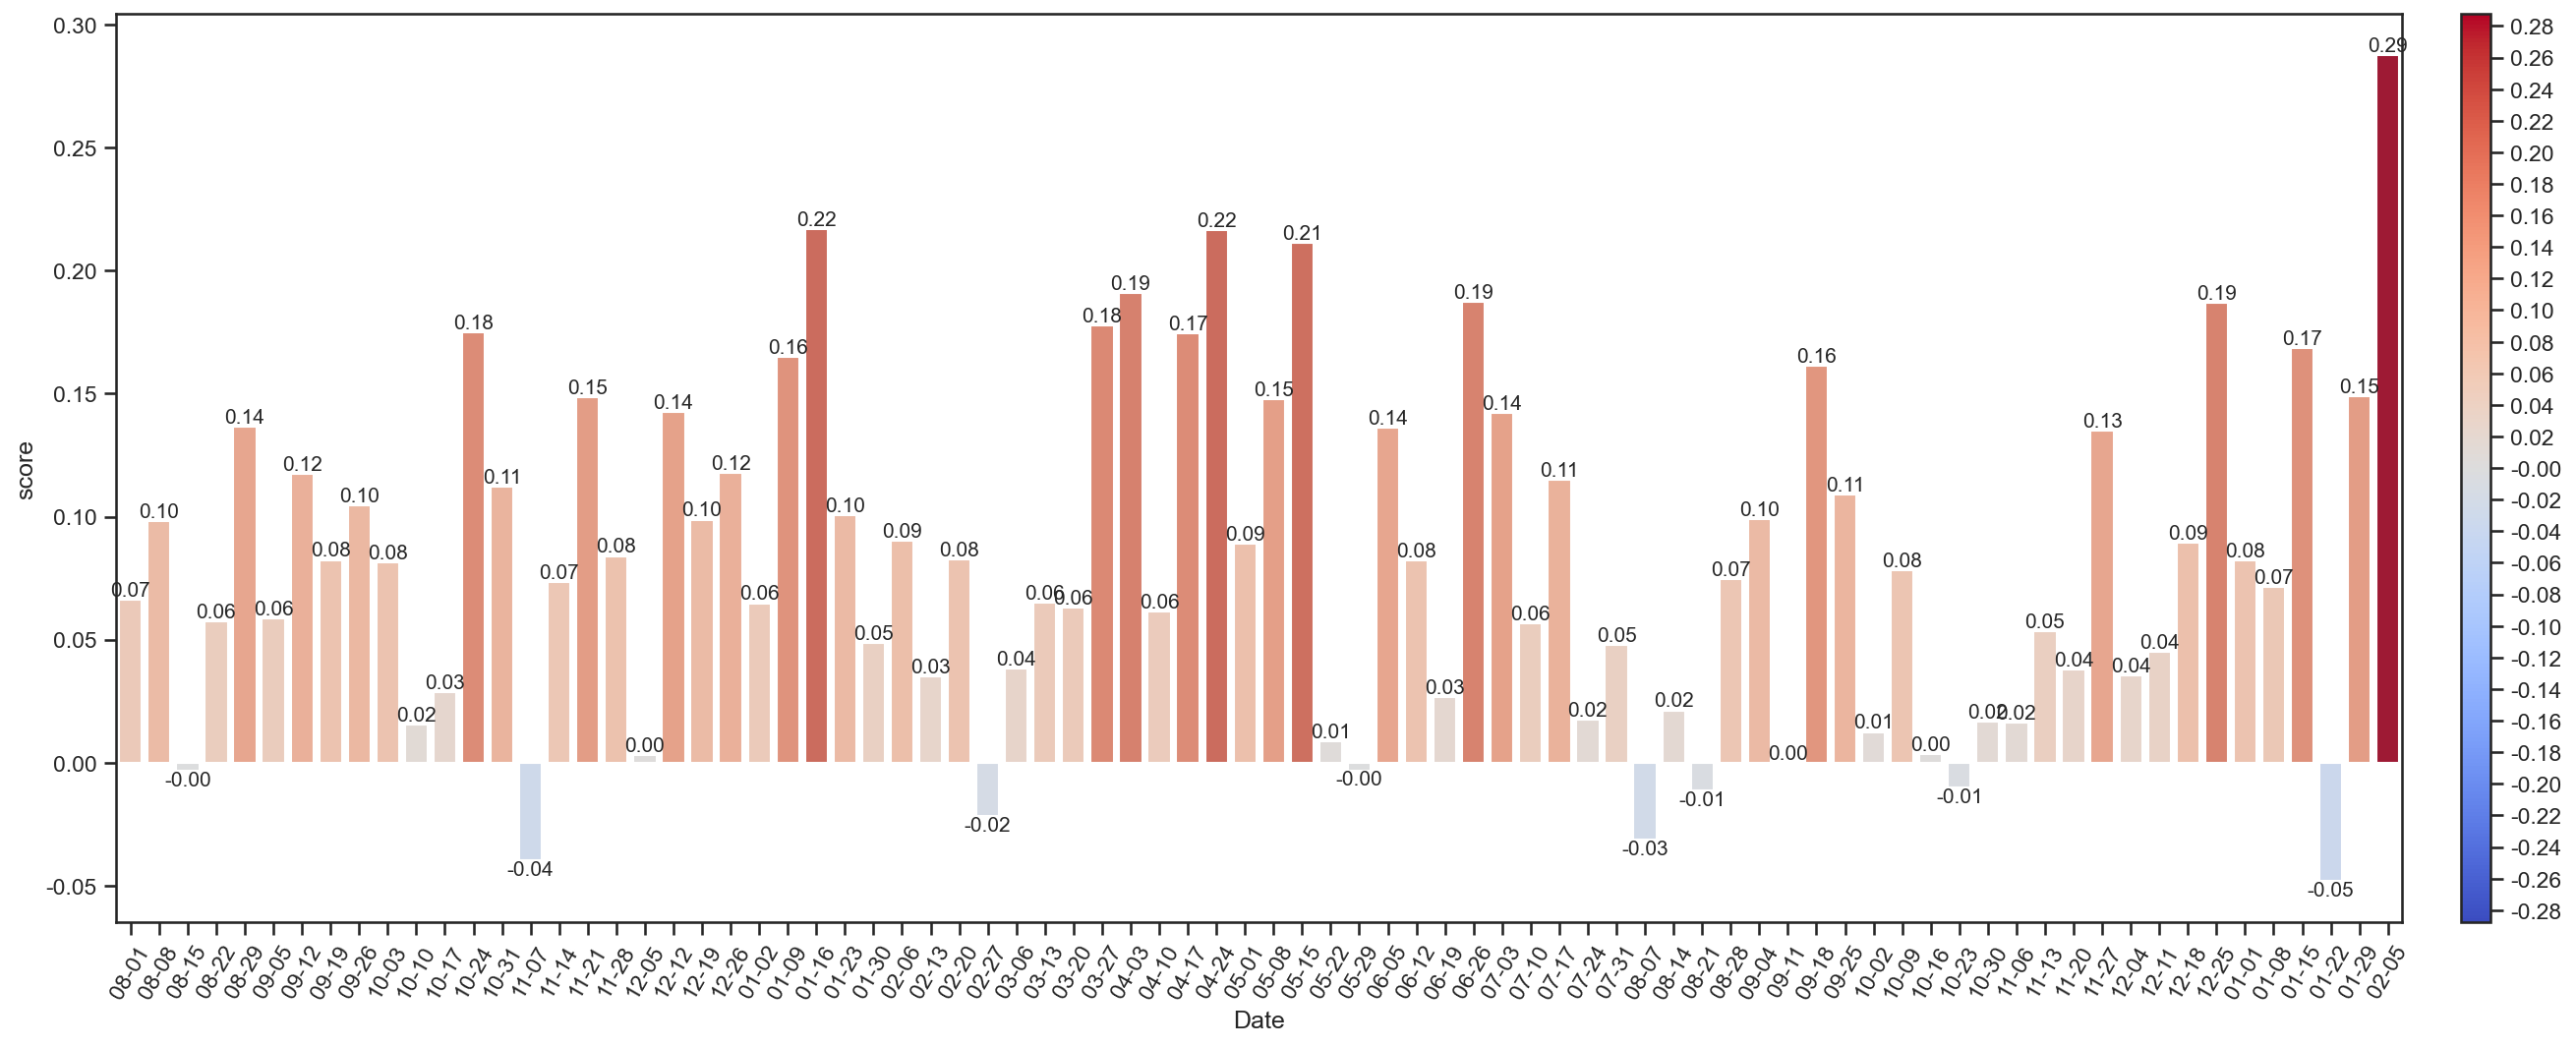
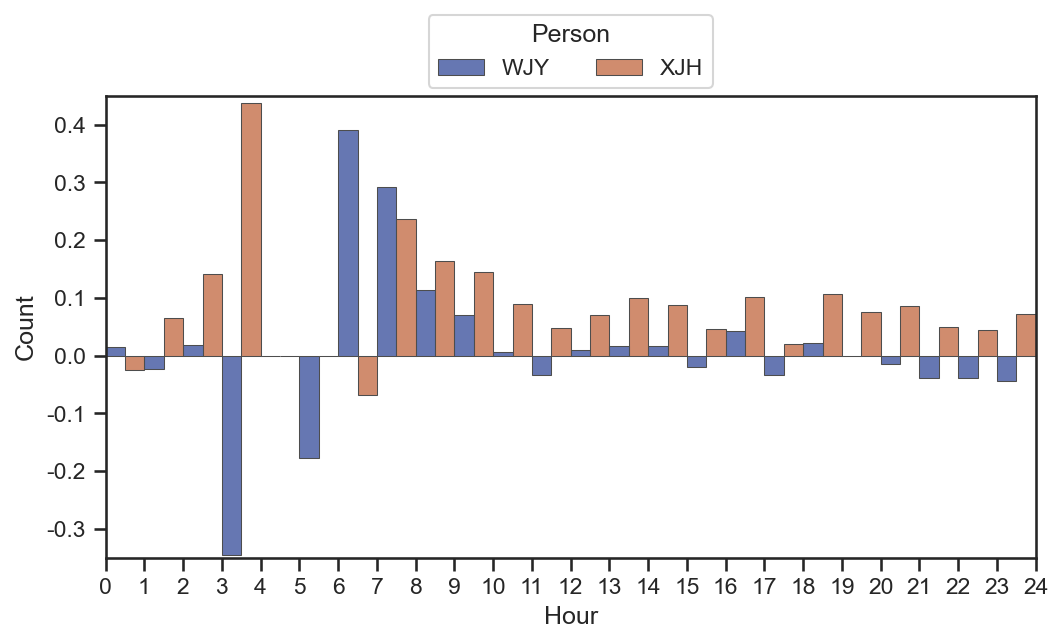
data = [] for k inrange(2): tmp = dfEs[k].groupby(grouper)["score"].mean().sort_index() for i inrange(24): if i in tmp.index: data.append(tmp[i]) else: data.append(0) data.append(0) data = pd.DataFrame( { "Score": data, "Person": [labels[0]] * 25 + [labels[1]] * 25, } )
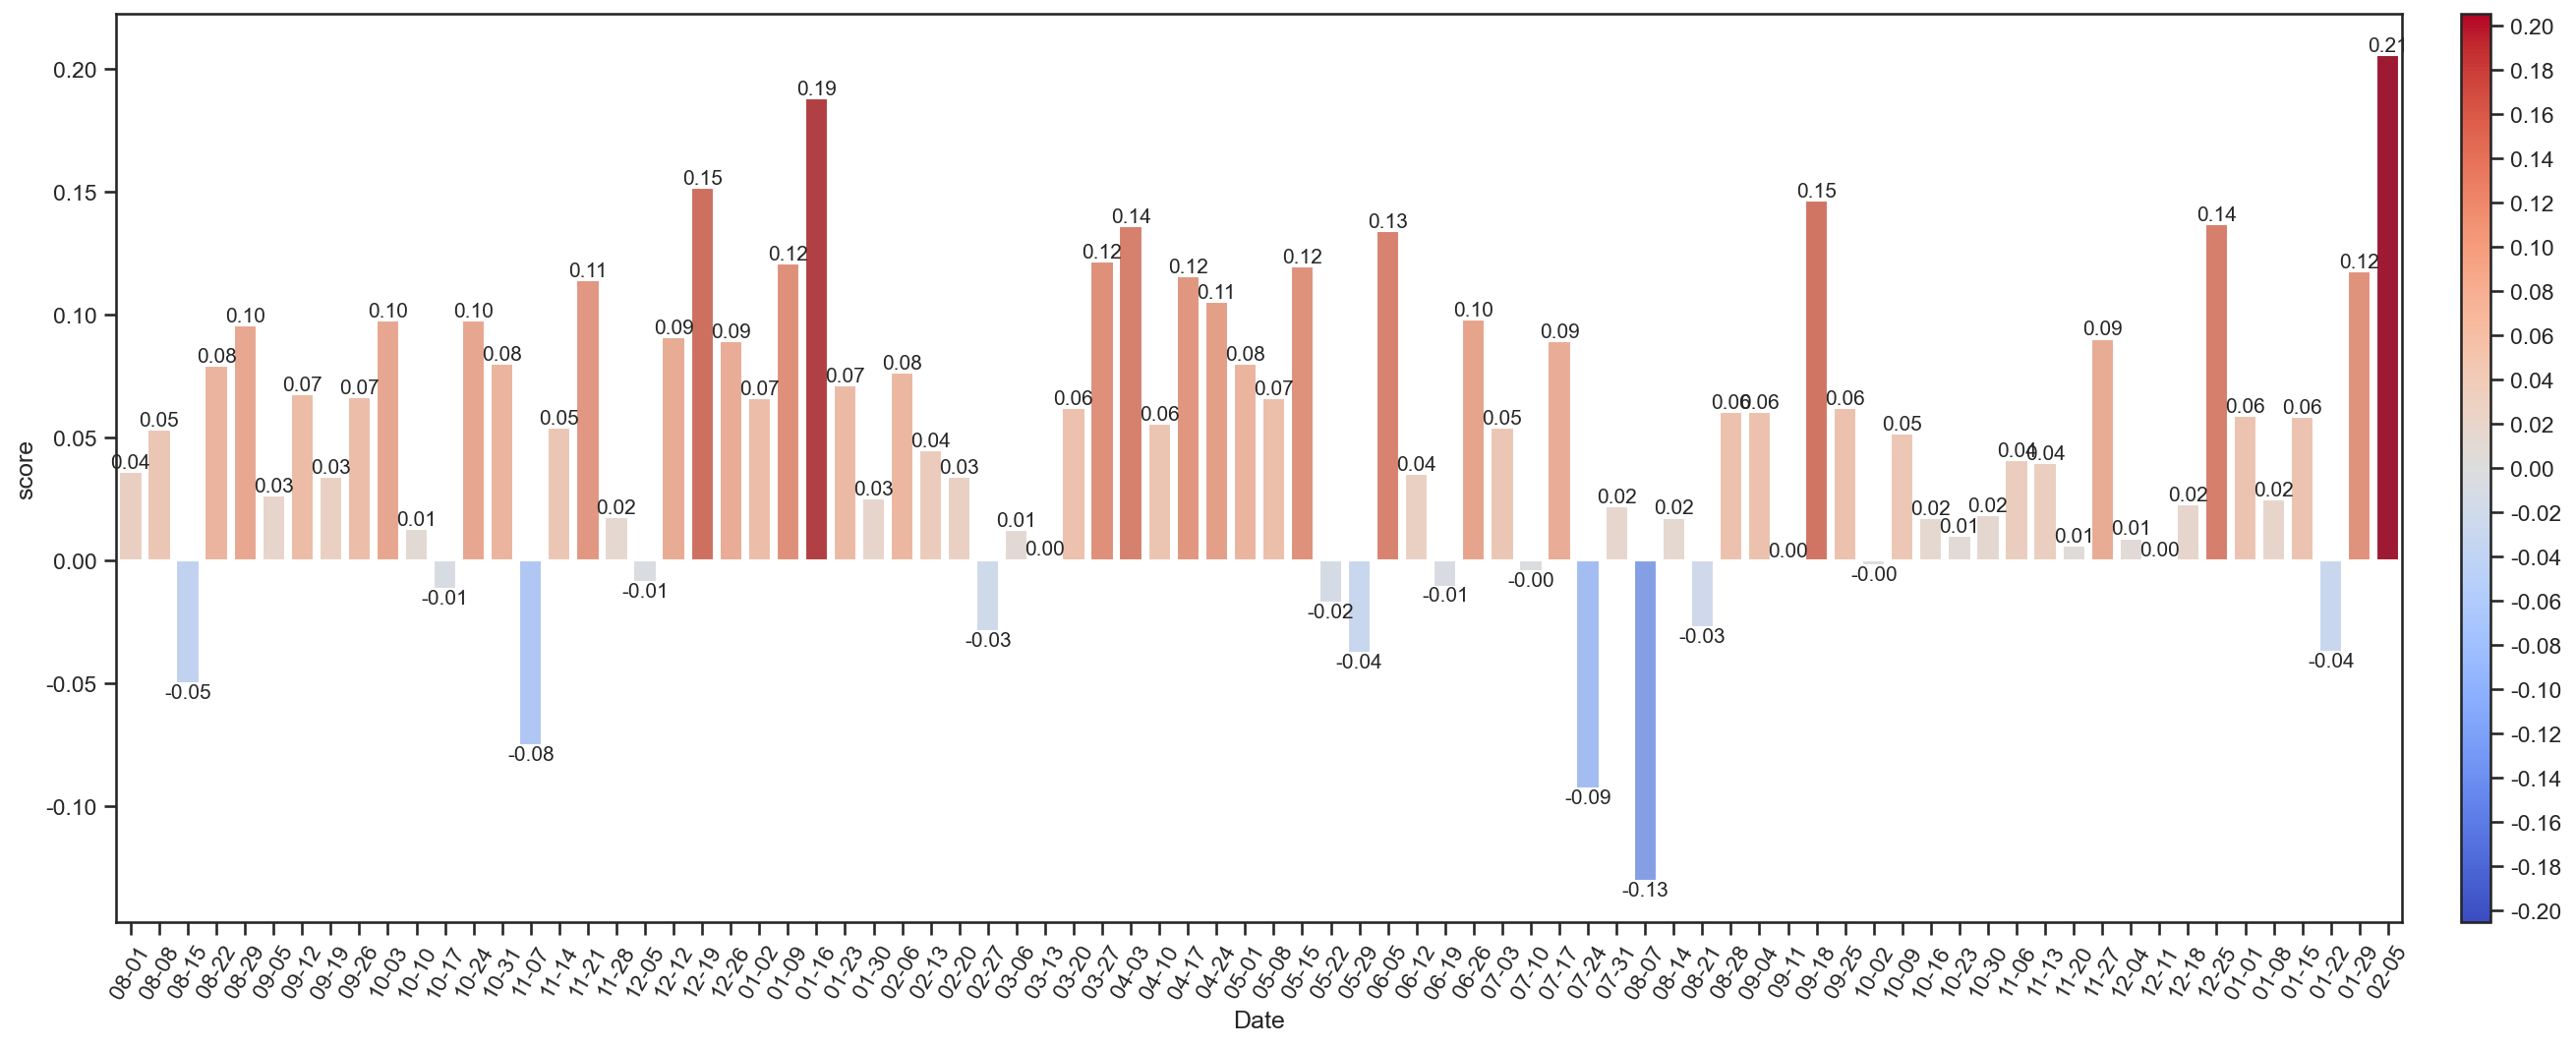
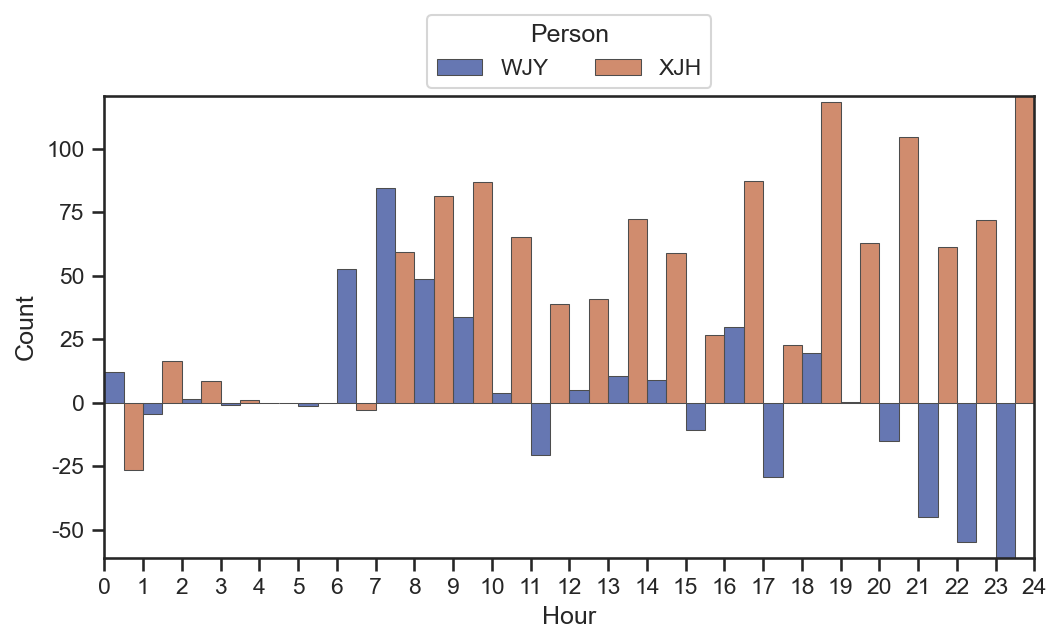
data = [] for k inrange(2): tmp = dfEs[k].groupby(grouper)["score"].sum().sort_index() for i inrange(24): if i in tmp.index: data.append(tmp[i]) else: data.append(0) data.append(0) data = pd.DataFrame( { "Score": data, "Person": [labels[0]] * 25 + [labels[1]] * 25, } )